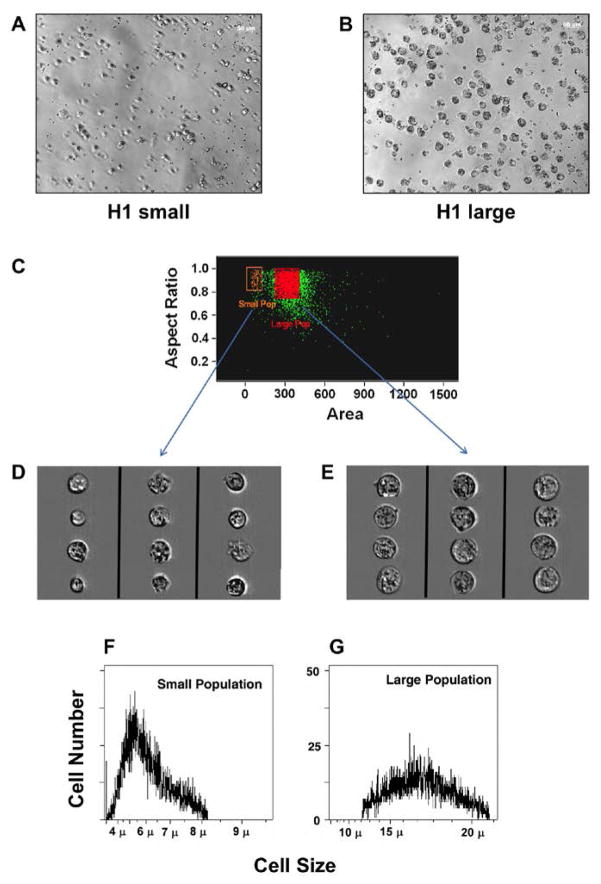
Figure 2. Two viable populations of hES have distinct sizes.
Isolation of cells from the two subpopulations using different methods, demonstrated viability and size differences. A) Microphotograph of H1 small cells sorted for size. B) Microphotograph of H1 large cells resorted for size. C) Image stream analysis of PI negative small and large populations stained with DRAQ5. D) Image stream analysis of small cells E) Image stream analysis of large cells. F) Cell Lab Quanta SC Analysis of cell size for small cells. G) Large cells.

