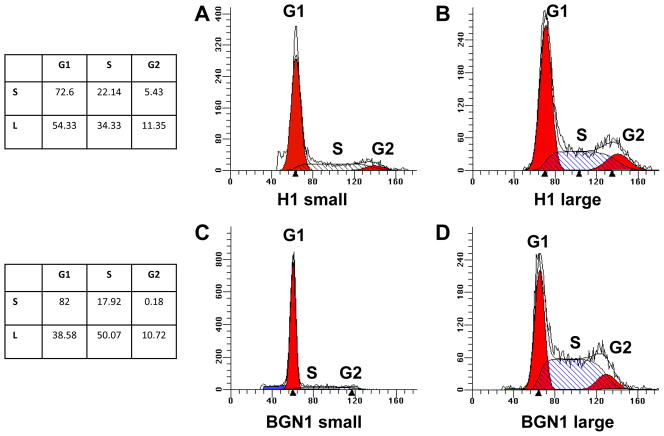
Figure 4. Cell cycle profiles of large and small populations of hES cells.
H1 and BGN1 hES cell cycle profiles of large and small populations identifying percentage of cells in G0–G1, S-phase (hatch bars) and G2 using the PI method of staining and Mod-fit software A) H1 hES cell cycle profile of the small population B) H1 hES cell cycle profile of the large population C) BGN1 hES small population cell cycle profile D) BGN1 hES cell large population cell cycle profile.

