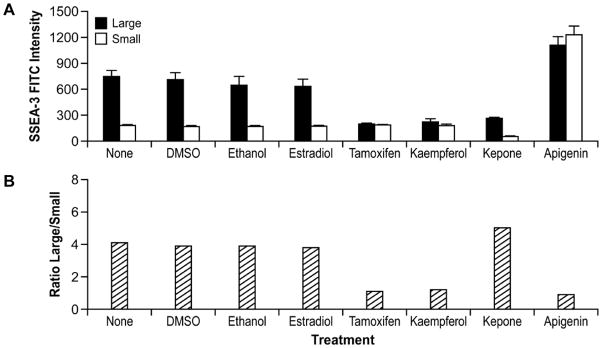
Figure 9. Differential responses by subpopulations to treatment with endocrine disruptor compounds.
A) H9 hES cells were grown and exposed to EDC for 2 days and hybridized with SSEA-3-FITC and then sorted for large and small populations expressing SSEA-3. Similar results are shown in B) Ratio of SSEA-3 positive large cells to SSEA-3 positive small cells.

