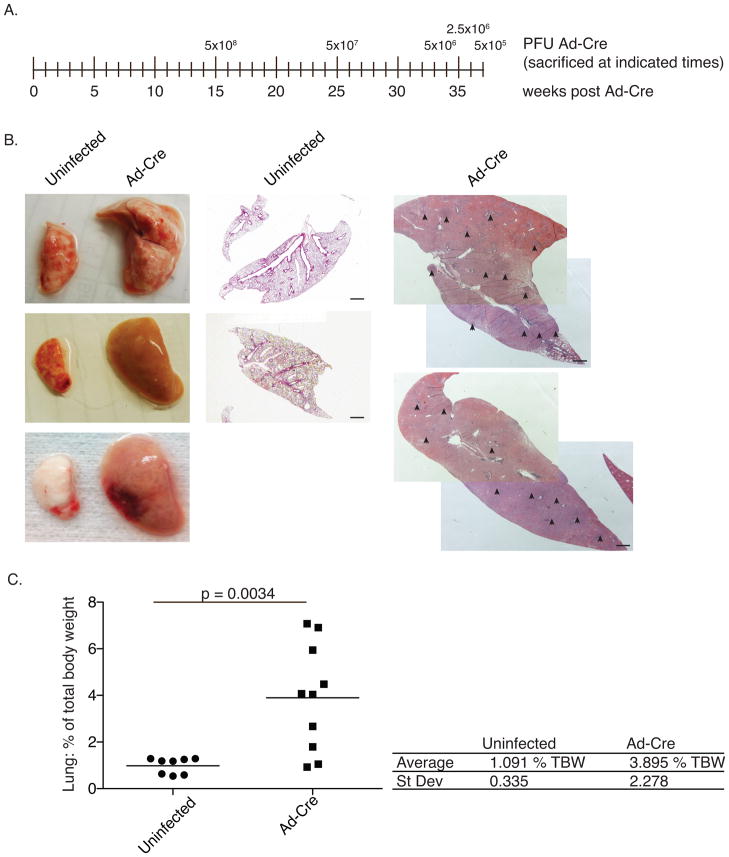
Figure 1. Tumors formed in KrasLSL-G12D/+;Trp53LSL-R172H/+mice.
Two animals were infected with each doses of Ad-Cre ranging from 5×10⁵ PFU to 5×10⁸ PFU. When quality of life was diminished animals were sacrificed. (a) Time-line indicating dose and time of sacrifice. (b) Representative lungs from control and Ad-Cre infected animals. Center and right panels are hematoxylin and eosin (H&E) stains of histological sections; note that the scale is the same for control and infected samples. Arrowheads point to tumors. Black bars = 1 mm (c) Ad-Cre infected lungs were grossly enlarged at time of sacrifice relative to uninfected control lungs. Following perfusion, lungs were harvested, weighed, and are graphed as a percentage of total body weight for each individual mouse. The black bar indicates the mean. p-values were determined by two-tailed t-test.

