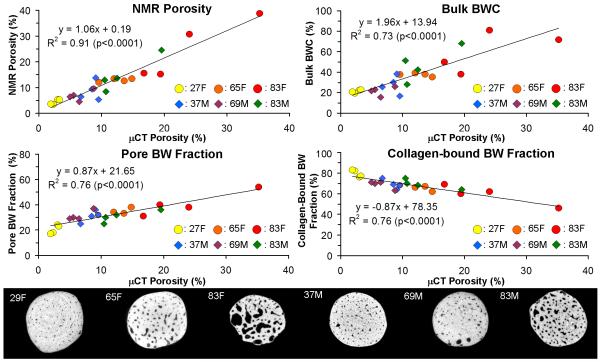
Figure 4.
Top: correlations of NMR porosity, bulk BWC, mobile BW fraction, versus μCT porosity. Circles and diamonds represent female and male donor specimens, respectively. Bottom: sample axial slices from 3D μCT images (16 μm3 voxel size) of male (37y, 69y, 83y) and female (27y, 65y, 83y) anterior bone specimens.

