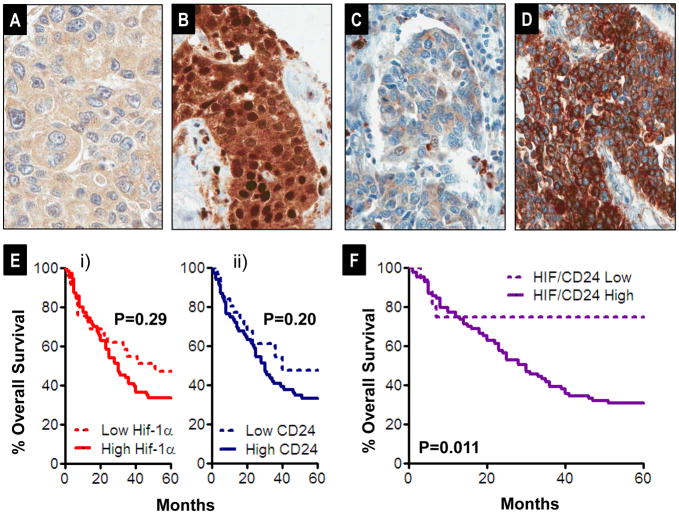
Figure 7.
A–B) Representative 0+ (%0 nuclear positivity) and 3+ (>50% nuclear positivity) staining of HIF-1α on tissue microarray cores of human urothelial carcinoma, respectively. C–D) Representative 1+ (weak intensity) and 3+ (diffuse, intense) CD24 staining, respectively. E) Kaplan Meier analysis of overall survival post cystectomy of 101 urothelial carcinomas from the tissue microarray, stratified as a function of i) CD24 level (low CD24 (0+, 1+, N=31) and high CD24 (2+ and 3+, N=70)). Differences evaluated by Log Rank test. ii) Similar analysis to that of i) but comparing survival stratified by low HIF-1α (0+ and 1+ nuclear positivity, N=29) and high HIF-1α (2+ and 3+, N=72). F) Similar analysis to that in E but examining survival as a function of HIF-1α and CD24 combined (HIF+CD24) score, comparing low scores (0+, 1+, and 2+, N=16) to high scores (3+ to 6+, N).

