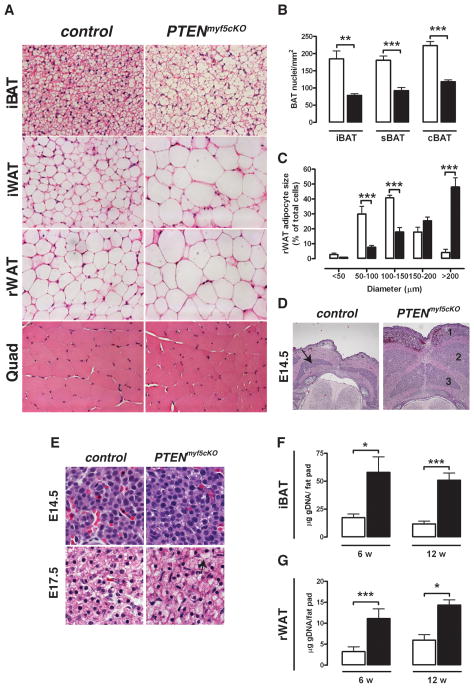
Figure 2. PTEN-deficient fats have large adipocytes and more total cells.
(A) H&E images of iBAT, iWAT, rWAT and quadriceps from a control and PTENmyf5cKO mouse (40×).
(B) Nuclei density per mm2 of iBAT, sBAT and cBAT (n=5, 6 w old).
(C) rWAT adipocytes cell diameter from 6 week old mice (n=7)
(D) Images of H&E stained E14.5 control and PTENmyf5cKO embryo sections (10×). Brown fat is marked with an arrow in control. In the mutant, iBAT (1), sBAT (2) and cBAT (3) precursor pools are enlarged.
(E) Detail of embryonic BAT precursors at E14.5 and E17.5. Lipid droplets can be seen forming prematurely in the mutants by E17.5 (arrow).
(F) Total genomic DNA purified iBAT in 6 and 12 week old control (white bars) and PTENmyf5cKO (black bars) (n=8).
(G) Total genomic DNA from rWAT (n=8). Bars represent mean± SEM. T-test; *, p<0.05, **, p< 0.01, ***, p<0.001). See also Figure S2.

