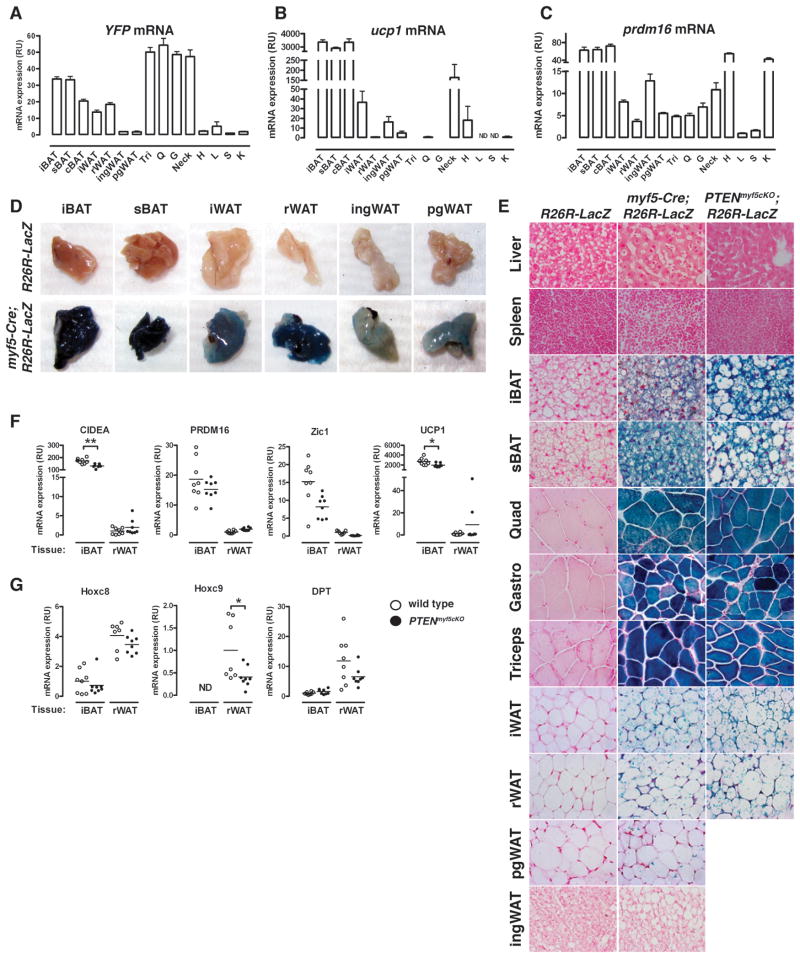
Figure 4. A subset of white adipocytes trace to the Myf5 lineage.
(A–C) YFP (A), Ucp1 (B), and Prdm16 (C) mRNA expression in tissues (n=5) prepared from myf5-cre;R26R-YFP mice (Tri:triceps; Q: quadriceps; G: gastrocnemius; H: heart; L: liver; S:spleen; K: kidney). In (A) YFP level detected in each tissue from mice lacking Cre was subtracted. Bars represent mean± SEM.
(D) Images of the indicated depots from a R26R-LacZ and a myf5-cre;R26R-LacZ mouse after X-Gal staining.
(E) β-galactosidase activity in tissues from negative control (R26R-LacZ) and from myf5-cre;R26R-LacZ or PTENmyf5cKO-LacZ mice. Counterstained with NFR. Liver and spleen at 40X; others at 63X. See also Figure S3.
(F) qRT-PCR analysis of Cidea, Prdm16, Zic1, Ucp1, HoxC8, HoxC9 and DPT in whole iBAT and rWAT. (n=8; Horizontal line indicates the mean. *, p<0.05; **, p< 0.01).

