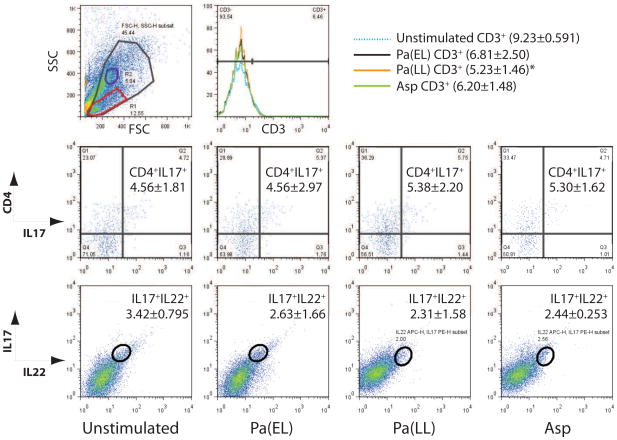
Figure 6. PLC shows minimal to modest IL-17 and IL-22 response to antigen stimulation.
Representative plots on a CF PLC sample are shown. (Top row) Live cell gate in SSC vs FSC plot was examined for CD3 status (histogram). Statistics for each stimulation are shown in the histogram legend. One stimulation condition resulted in statistically significant reduction in the number of CD3+ cells relative to the unstimulated sample [Pa(LL)]. The live cell gate was then examined for CD4 vs IL-17 (second row of plots) with statistics for the CD4+IL-17+ quadrant shown for each antigen stimulation. Similarly the live cell gate was examined for IL-17 vs IL-22 in each antigen stimulation and statistics are shown for the IL-17+IL-22+ quadrant (bottom row of plots). * p < 0.05

