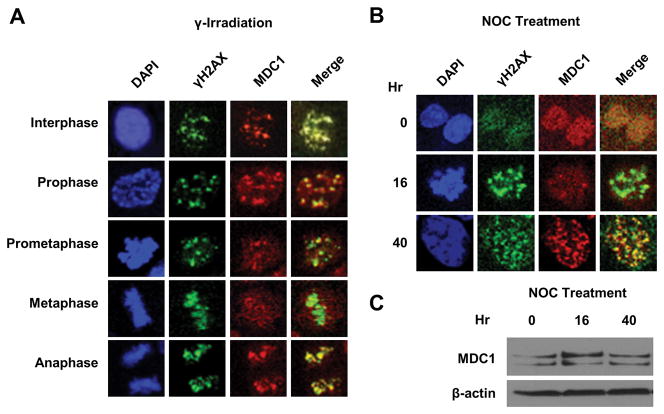
Figure 1. MDC1-γH2AX colocalization decreases during mitosis.
(A) Immunofluorescent staining of MDC1 and γH2AX in HCT116 cells following γ irradiation.
(B) Immunofluorescent staining of MDC1 and γH2AX during nocodazole (NOC) treatment. Representative prometaphase (16 h) and post-mitotic (40 h) cells were shown. The mitotic indices at the corresponding times points are shown in Suppl. Fig. S1. (C) Western blot of MDC1 in HCT116 cells at corresponding time points in (B).

