
Figure 7.
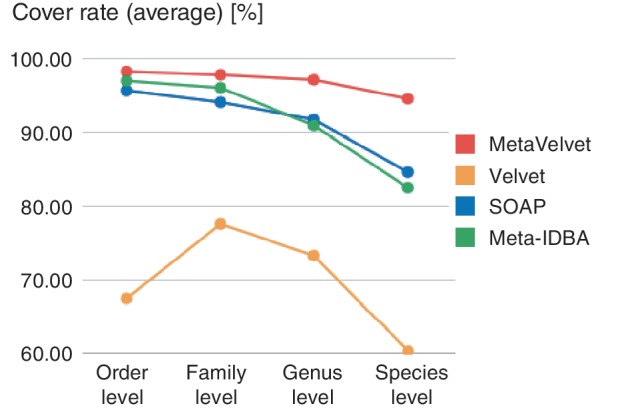
Cover rates for every taxonomic level are shown. The cover rate for each taxonomic level is the average of the cover rates for the 20 genomes in the taxonomic level.
Official websites use .gov
A
.gov website belongs to an official
government organization in the United States.
Secure .gov websites use HTTPS
A lock (
) or https:// means you've safely
connected to the .gov website. Share sensitive
information only on official, secure websites.
Cover rates for every taxonomic level are shown. The cover rate for each taxonomic level is the average of the cover rates for the 20 genomes in the taxonomic level.