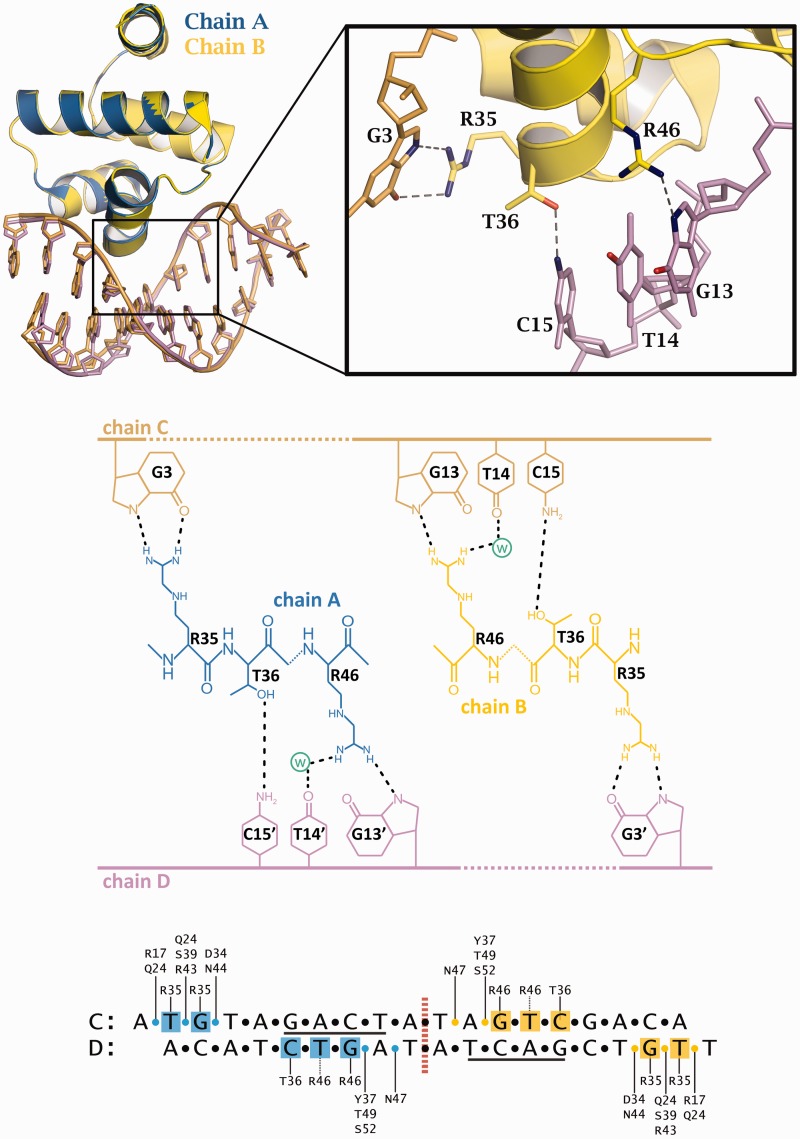
Figure 4.
DNA–protein contacts. Top: Rotation and superposition of the two subunits of the complex show symmetrical interactions to the DNA (inset: interactions of amino acids R35, T36 and R46 with bases G3 on one strand and G13, T14 and C15 on the other; the water atom is omitted for clarity). Middle: Schematic representation of the hydrogen bonding contacts. Bottom: Overview of specific base contacts and contacts to the DNA phosphates (yellow and blue circles).

