Figure 4.
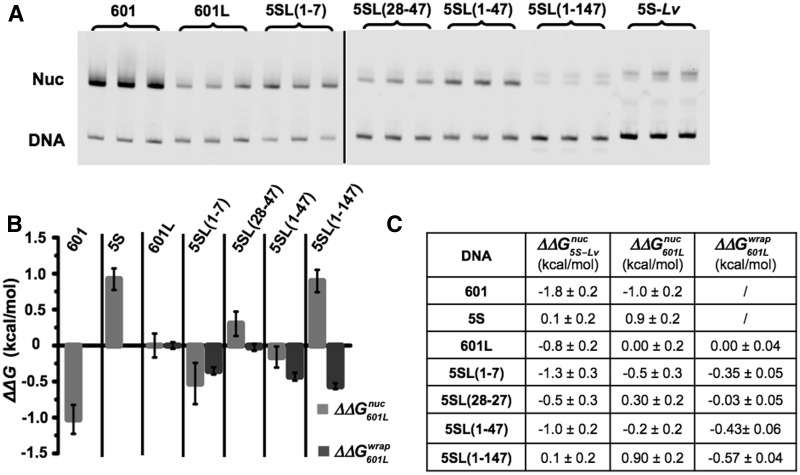
Relation between DNA–histone binding and DNA unwrapping free energies. (A) Cy3 fluorescence image of native PAGE analysis of competitive reconstitutions performed in triplicate for unmodified HO with the DNA chimeras used for site exposure measures. (B) Change in free energy of nucleosome formation (ΔΔGnuc, light gray) relative to 601L as determined by competitive reconstitution from the gel in (A), and the change in nucleosome free energy for wrapping (ΔΔGwrap, dark gray) relative to 601L as determined from site accessibility measures (Figure 3B and C). The error bars for ΔΔGnuc are the SD of the three independent measurements for each nucleosome type. (C) Table of the change in free energy values in kcal/mol for nucleosome formation of each DNA species relative to Lumbriculus variegatus 5S NPS  , for nucleosome formation of each DNA species relative to 601L DNA
  and for nucleosome wrapping for each DNA species relative to 601L DNA
  .
.

