Figure 2.
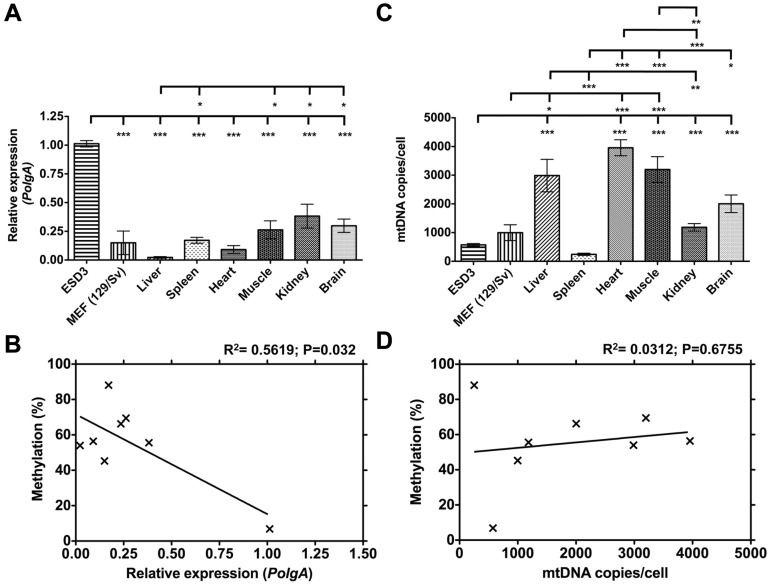
DNA Methylation of exon 2 correlates with reduced steady state mRNA levels of PolgA. (A) Real time PCR quantification of PolgA expression in cultured ESD3 and MEF cells, and in liver, spleen, heart, muscle, kidney and brain samples, expressed relative to ESD3. (B) The relationship between DNA methylation levels from Figure 1L and the corresponding PolgA expression was determined using Pearson correlation coefficient (R2). (C) MtDNA copies/cell in cultured ESD3 and MEF cells, and liver, spleen, heart, muscle, kidney and brain, as determined by real time PCR. (D) The relationship between the levels of DNA methylation from Figure 1L and the corresponding mtDNA copies/cell was determined using Pearson correlation coefficient (R2). Values represent mean ± SEM and significant differences between cell types are: *P < 0.05; **P < 0.01 and ***P < 0.001.

