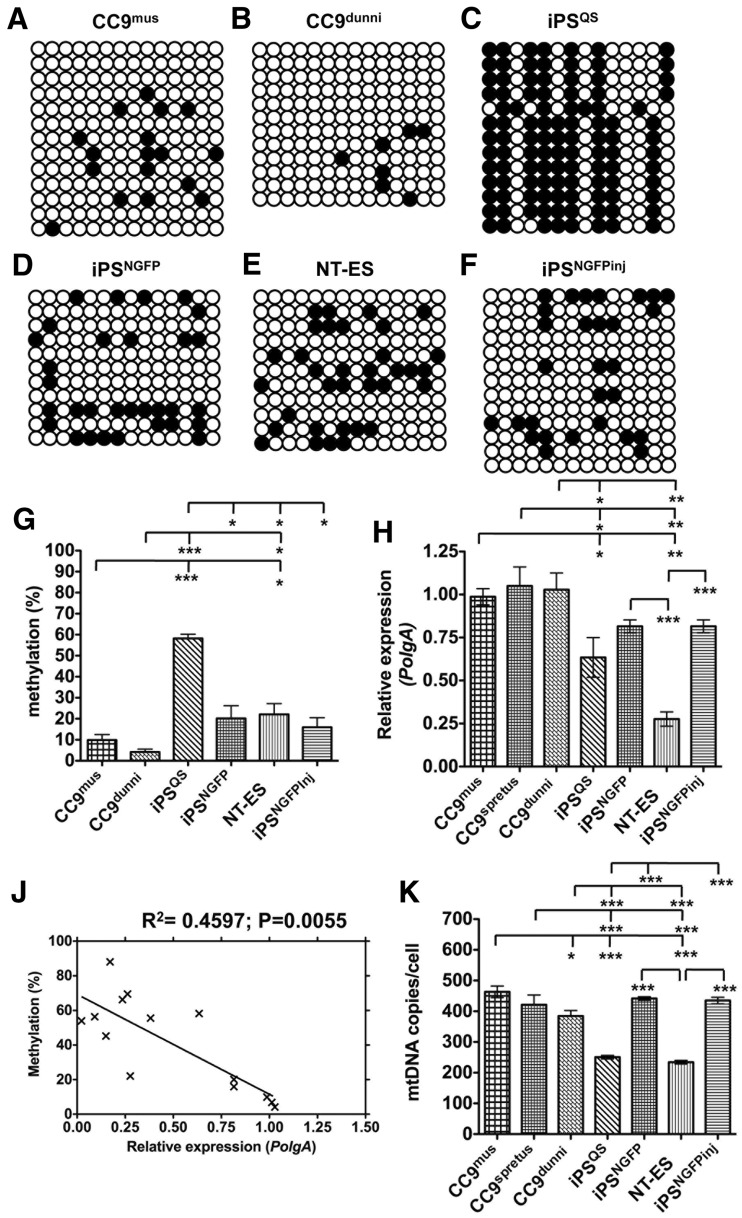
Figure 3.
Intragenic methylation of PolgA in reprogrammed and mtDNA divergent ESCs. Bisulphite sequencing analysis of CpG methylation in (A) CC9mus, (B) CC9dunni, (C) iPSQS, (D) iPSNGFP2 (E) NT-ES, (F) iPSNFGPinj pluripotent stem cells. (G) The percentage CpG methylation per sequence determined by bisulphite sequencing (percentage mean ± SEM). (H) Real time PCR quantification of PolgA expression in cultured CC9mus, CC9spretus, CC9dunni, iPSQS/R26 (iPSQS), iPSNGFP, NT-ES, iPSNGFPinj pluripotent stem cells expressed relative to ESD3 cells. (J) Cumulative analysis of the relationship between DNA methylation levels (Figures 1L and 3G) and the expression of PolgA (Figures 2A and 3H) performed using Pearson correlation coefficient (R2). (K) MtDNA copies/cell in cultured CC9mus, CC9spretus, CC9dunni, iPSQS/R26, iPSNGFP, NT-ES, iPSNGFPinj pluripotent stem cells. Values represent mean ± SEM and significant differences between cell types are: *P < 0.05; **P < 0.01 and ***P < 0.001.

