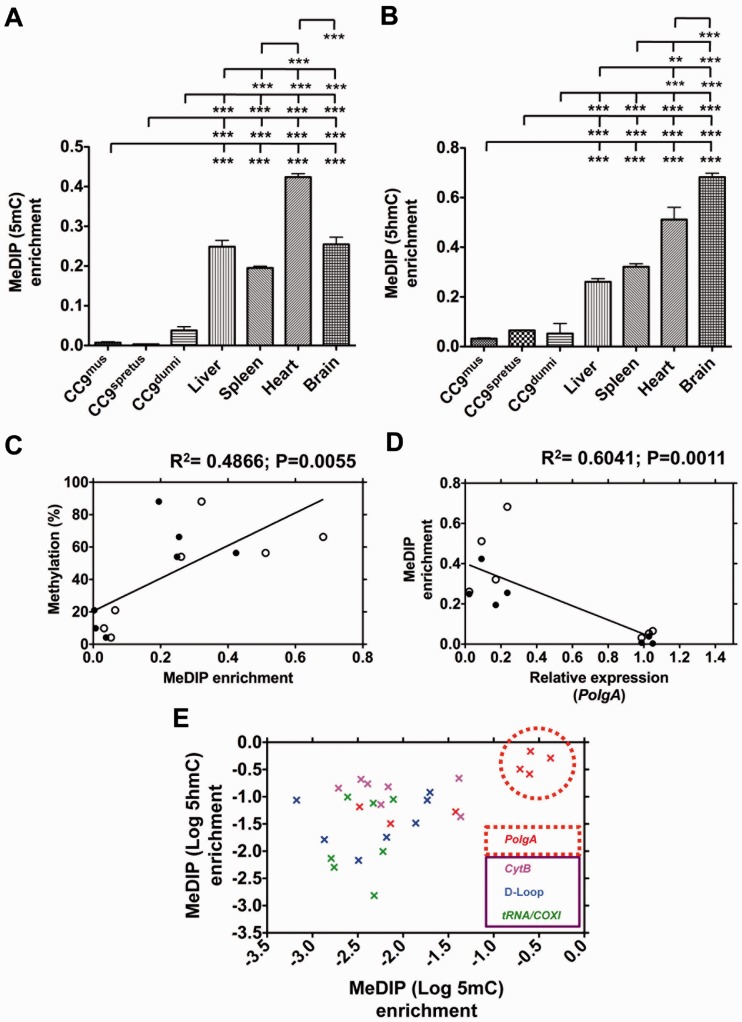
Figure 4.
Analysis of PolgA and mtDNA enrichment in 5mC and 5hmC MeDIP of ESCs and somatic tissues. DNA samples from cultured CC9mus, CC9spretus and CC9dunni cells; liver, spleen, heart and brain samples were immunoprecipitated using antibodies against (A) 5mC and (B) 5hmC, and analysed using real time PCR for PolgA (exon 2) enrichment. Bars represent means ± SEM. Significant differences between cell types are indicated (**P < 0.01; ***P < 0.001). (C) MeDIP (5mC and 5hmC) enrichment (Figure 4A and B) was validated against the corresponding means for bisulphite sequencing methylation levels (Figures 1L and 3G) using Pearson correlation coefficient (R2). Closed circles represent 5mC enrichment and open circles represent 5hmC enrichment. The P-value signifies the significance of the line from zero. (D) The relationship between PolgA expression and the corresponding MeDIP (5mC and 5hmC) enrichment levels using a Pearson correlation coefficient (R2). Closed circles represent 5mC enrichment and open circles represent 5hmC enrichment. The P-value signifies the significance of the line from zero. (E) Real time PCR for the enrichment of PolgA (exon 2) and mtDNA (CytB, tRNA/COXI and D-loop regions) in 5mC and 5hmC immunoprecipitated DNA. Enrichment values for CC9mus, CC9spretus and CC9dunni cells; and liver, spleen, heart and brain samples were normalized against β-actin (unmethylated control). Data shown is log10 5mC against log10 5hmC. Data points are colour-coded to represent DNA sequences analysed (PolgA exon 2 and mtDNA: CytB, tRNA/COXi and D-loop regions). Data points highlighted in the red circle represent the high levels of enrichment observed for liver, spleen, heart and brain samples (cf Figure 4A and B).

