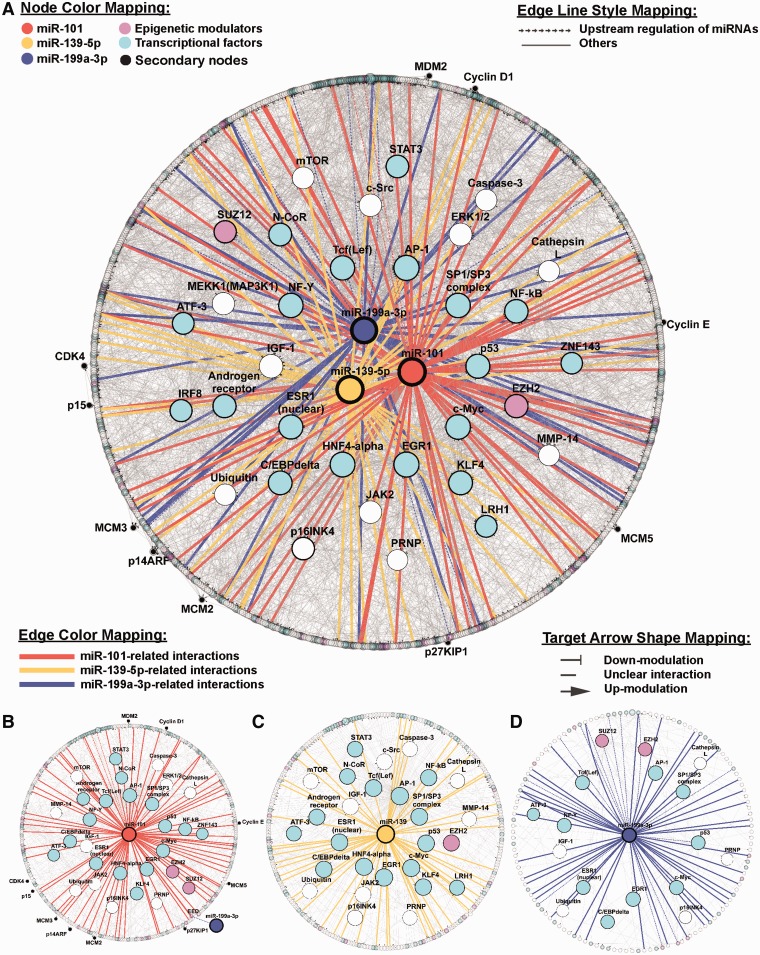
Figure 5.
microRNA-centered interactome network from cluster 6. Nodes with a top 5% Betweenness value from cluster 6 interactome and miR-101, miR-139-5p and miR-199a-3p are highlighted. The distribution of nodes was based on the Betweenness values rather than the regulatory level of the interactions. The higher the rank percentile, the more centered the node. The entire regulatory network (811 nodes and 2975 edges) is shown in (A). (B–D) depicts the miR-101-, miR-139-5p- and miR-199a-3p-centered subnetworks, respectively. The subnetworks for each specific miRNA were constructed by a two-step shortest path of regulatory interactions. There are 382 nodes and 552 edges in the miR-101-centered subnetwork (B), 287 nodes and 354 edges in the miR-139-5p-centered subnetwork (C) and 142 nodes and 166 edges in miR-199a-3p-centered subnetwork (D). Genes are represented by nodes and functional associations by edges.

