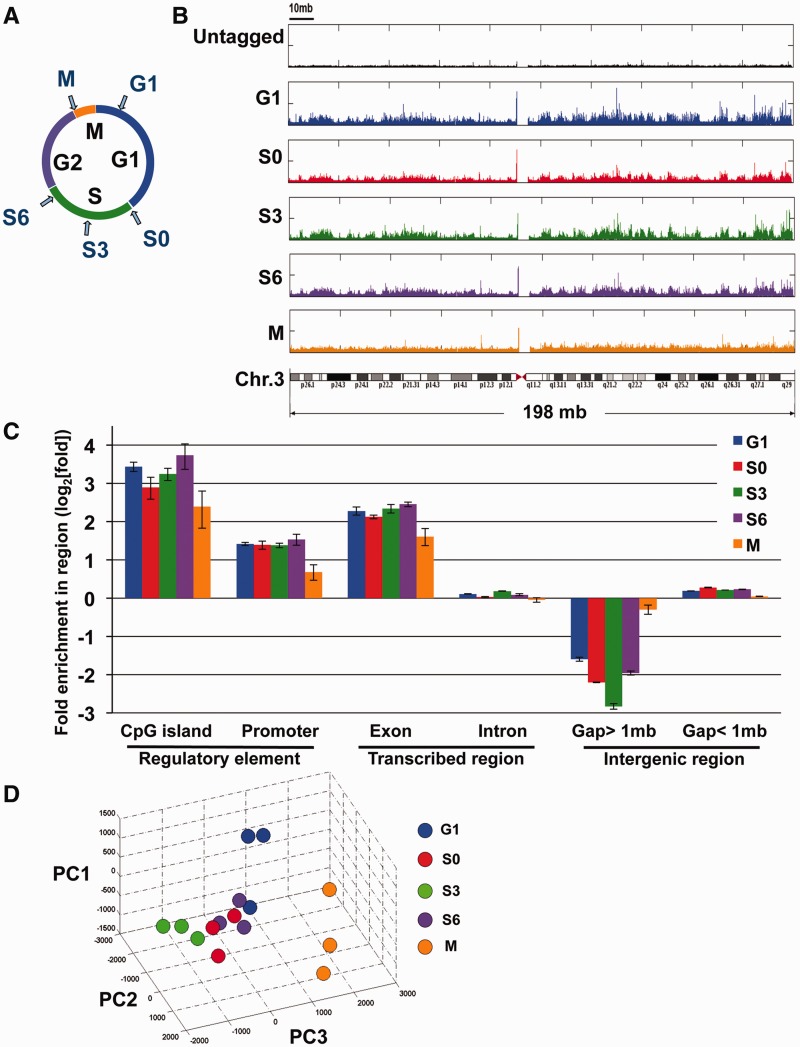
Figure 1.
Genome-wide analysis of SUMO-1 binding. (A) Sample collection for mapping the chromatin localization of SUMO-1 throughout the cell cycle. HeLa cells were treated with double-thymidine block and released for 0, 3, 6, 13 h to obtain S0, S3, S6 and G1 samples, respectively, and cells in mitosis (M) were treated with a sequential thymidine-nocodazole block. (B) Histogram depicting the locations of SUMO-1-binding sites on chromosome 3 of the human genome using chromatin affinity sequence analysis (ChAP-seq). The frequency of raw reads was plotted along the length of the chromosome with bin-size 1 kb. Samples were ChAP-purified DNAs from HeLa-SUMO cells during G1 (blue, panel 2), early S phase (S0, red, panel 3), mid-S phase (S3, green, panel 4), late S phase (S6, purple, panel 5), mitosis (M, orange, panel 6) and results from affinity purification using a HeLa cell line that does not express the tagged SUMO-1 protein (black, panel 1). A diagram of chromosome 3 is shown at the bottom. (C) Peak annotation depicts fold change on log2 scale of SUMO-1 binding sites on defined sequence elements on the human genome relative to the expected frequency of the genetic elements distributed in the genome if the binding profile is randomly distributed. G1 (blue), early S phase (S0, red), mid-S phase (S3, green), late S phase (S6, purple) and mitosis (M, orange), and error bars are SEM from three biological repeats. (D) Fifteen SUMO-1 datasets of chromosome 1 were represented in a three-dimensional stereoscopic image by using standard PCA (see ‘Materials and Methods’ section) to show the reproducibility within each set of biological replicates as well as the separation of data among different cell stages. Each color ball represents individual dataset collected from indicated cell stage. The same color denotes the biological replicates of the same collection point during cell cycle.

