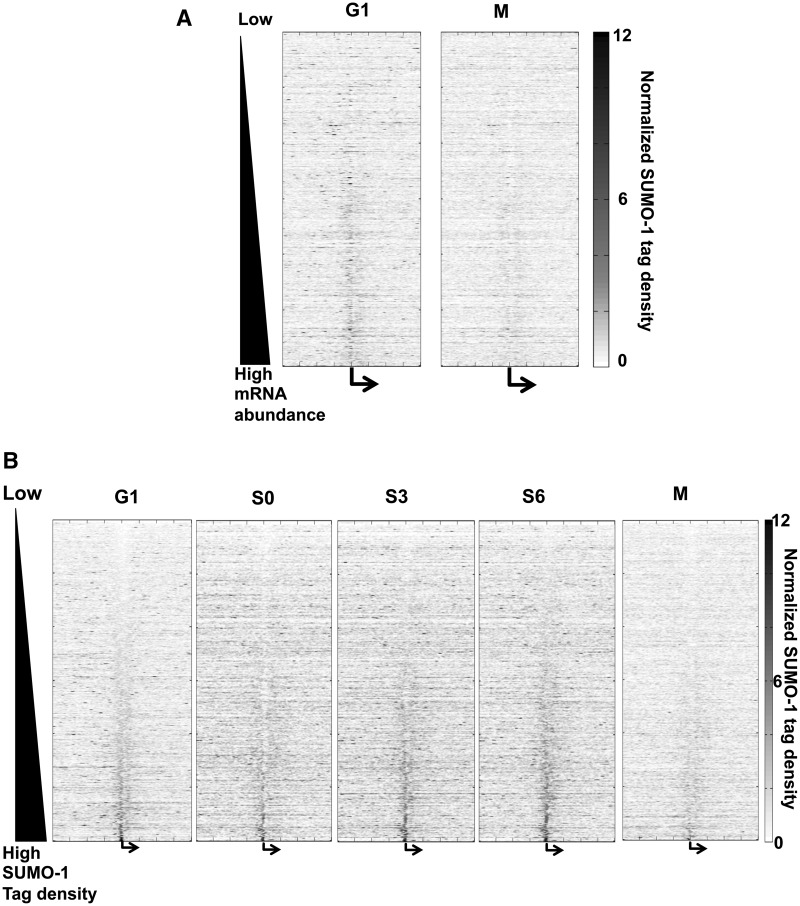
Figure 3.
SUMO-1 is associated with chromatin of active genes. (A) The heat maps of normalized SUMO-1 tag densities on genes (±10 kb surrounding the TSSs), sorted by gene expression level from low (top) to high (bottom) in G1 and M phases. Each row is a gene’s SUMO-1 tag density trace using the average of normalized tag density at each stage of the cell cycle. The vertical center (bent arrow) denotes the TSSs. The density of the SUMO-1 tag is indicated by the color; blue is low level to white, and red are progressively higher levels of SUMO-1. (B) Heat maps are similar to those in panel A, but the order of the genes (rows) is according to the density of SUMO-1 near the TSSs from low (top) to high (bottom) during G1. Similar heat maps are shown for each indicated phase of the cell cycle, and the order of genes (rows) is the same as in G1.

