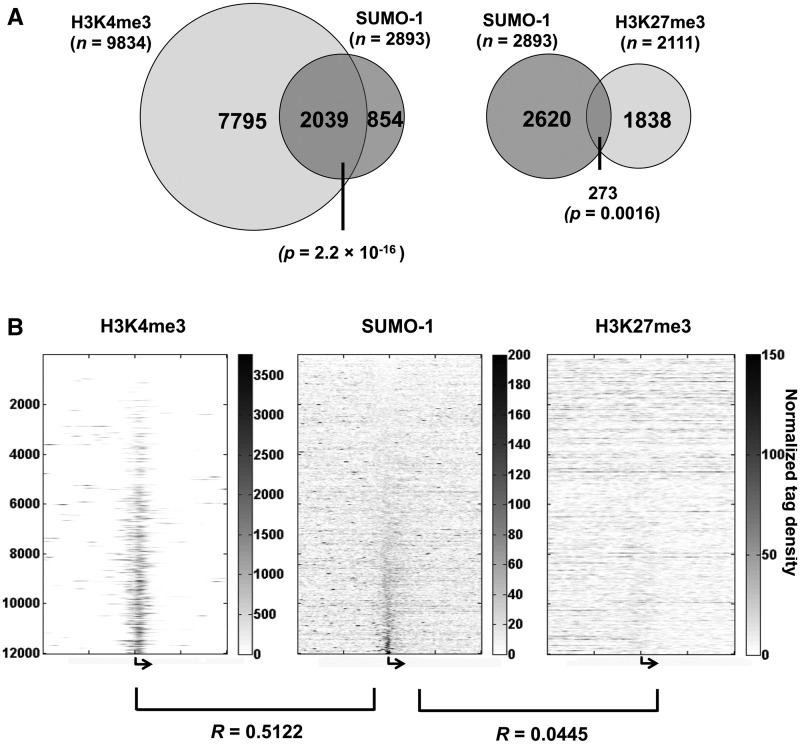
Figure 4.
SUMO-1-marked promoters are associated with genes marked with H3K4me3. (A) The Venn diagram depicts the degree of overlap between the SUMO-1-marked promoters and H3K4me3-marked promoters (left) as well as SUMO-1-marked promoters and the H3K27me3-marked promoters (right). (B) The heat maps of chromatin marks (H3K4me3, SUMO-1 and H3K27me3, respectively) on each gene ±10 kb surrounding the TSSs (bent arrow). Each row represents the corresponding tag density trace for each individual gene; rows are ordered and kept the same in each heat map according to the maximum intensity of SUMO-1 labeling in the peak region (−1600 to 400 bp) of G1-stage sample. The Pearson correlation coefficients between SUMO-1 and H3K4me3 or H3K27me3 are shown (see ‘Materials and Methods’ section).

