Figure 1.
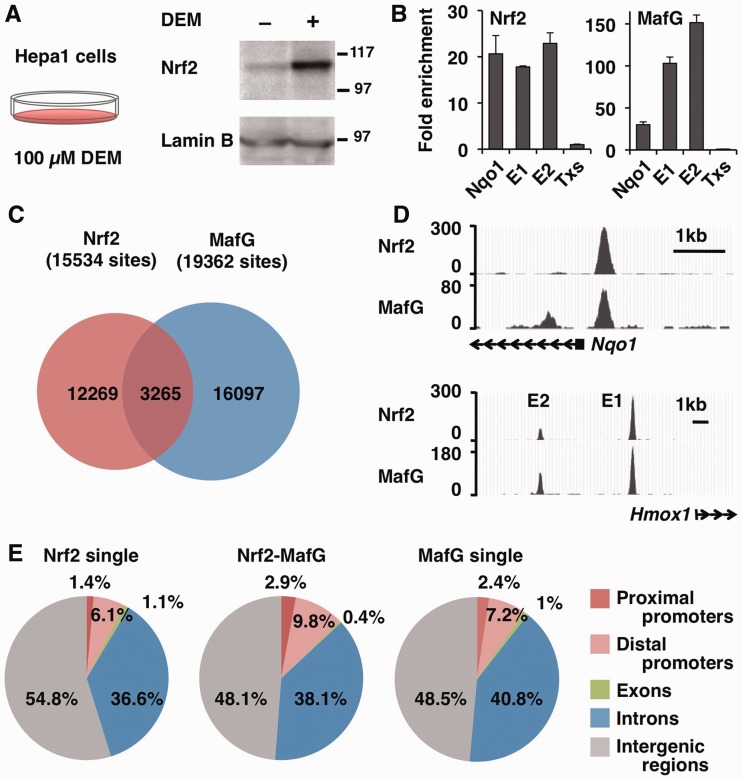
Identification of Nrf2- and MafG-binding sites by ChIP-seq analysis. (A) Immunoblot analysis of Nrf2 protein in nuclear lysates of Hepa1 cells treated with 100 -µM DEM or DMSO for 4 h. Lamin B was detected as a loading control. The molecular weight in kDa is shown at right. (B) Validation of the ChIP-seq library. ChIP was performed with Nrf2 and MafG antibodies, and the precipitated DNA was used to make the ChIP-seq library. qPCR was performed to verify the enrichment of regulatory regions of the Nqo1 gene and Hmox-1 gene E1 and E2 enhancers. The third intron of the thromboxane synthase (Txs) gene was used as a negative control locus, and its level was set to 1. (C) Venn diagram showing the overlap between the Nrf2 and MafG-binding sites. Overlapping peaks are defined by an intersection of the distance between the peak summit within 268 bp. (D) The ChIP-seq profiles around the Nqo1 promoter and Hmox-1 E1 and E2 enhancers are shown as UCSC genome browser shots. (E) Identification of the genomic location of Nrf2 single binding sites, Nrf2–MafG-binding sites and MafG single binding sites using CEAS. The diagram illustrates the overall distribution of the Nrf2–MafG-binding sites into the proximal promoters (<–1 kb), distal promoters (–1 to –10 kb), exons, introns and intergenic regions.

