Figure 3.
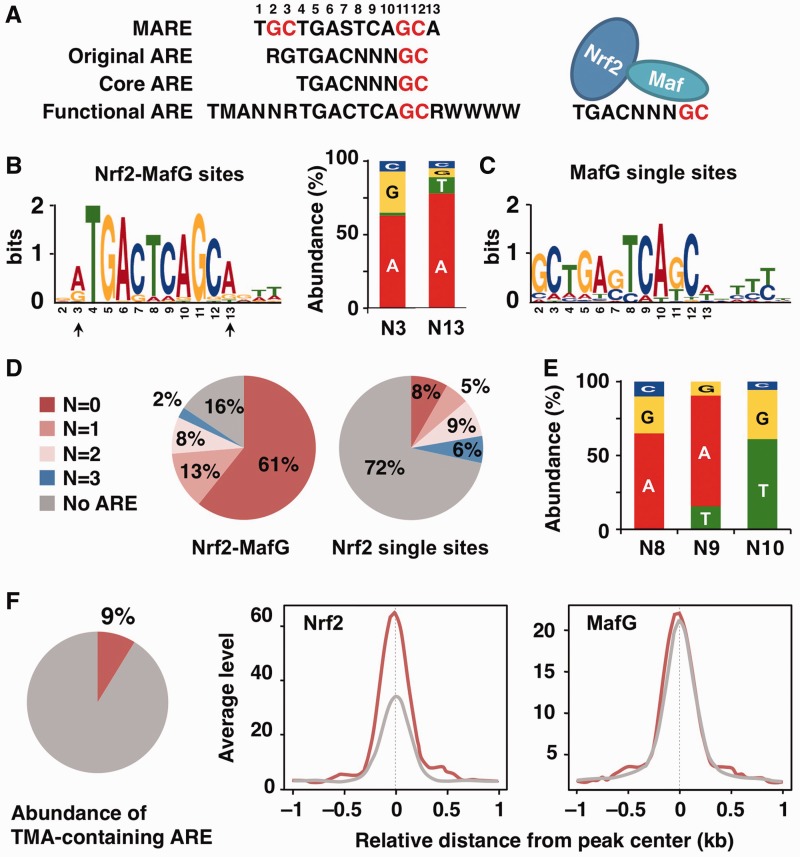
In vivo Nrf2- and MafG-binding motifs. (A) The consensus sequences of the MARE, original ARE, core ARE and functional ARE (S = G or C, M = A or C, R = A or G, W = A or T). GC boxes are shown in red. The left side and right side of the core ARE are shown to be recognized by Nrf2 and sMaf, respectively. (B, C) The enriched motif identified by the de novo motif-discovery algorithm MEME–ChIP in Nrf2–MafG-binding sites (B) and MafG single binding sites (C). The most significantly enriched motifs are shown. Nucleotide usage at N3 and N13 positions (indicated by arrows) of the enriched ARE is shown (B). (D) Pie charts show the percentage of classified AREs based on the number of variant nucleotides in NNN (from no variant to three variant nucleotides) in the Nrf2–MafG and Nrf2 single binding sites. The ARE motif was searched in the ± 150-nt region centered at the peaks. (E) Nucleotide usage at N8, N9 and N10 positions of the ARE with one variant nucleotide found in the Nrf2–MafG-binding sites. (F) A Pie chart shows the percentage of the TMA-containing ARE in the total core ARE found in the Nrf2–MafG-binding sites. Average profiles of Nrf2 and MafG ChIP-seq signals in the Nrf2–MafG-binding sites with (red line) or without (gray line) TMA motif. The profiles of 2.0-kb regions centered on the peak summit are shown.

