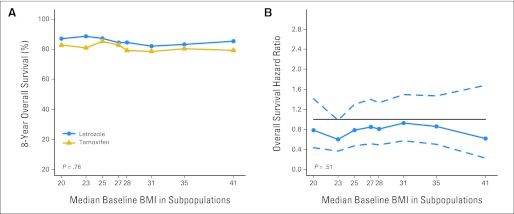
Fig 5.
Subpopulation treatment effect pattern plots showing (A) 8-year overall survival according to randomly assigned treatment group across a continuum of baseline body mass index (BMI) subpopulations and (B) overall survival hazard ratio (solid line) with 95% confidence bands (dashed lines) comparing letrozole versus tamoxifen across a continuum of baseline BMI subpopulations.

