
Figure 5.
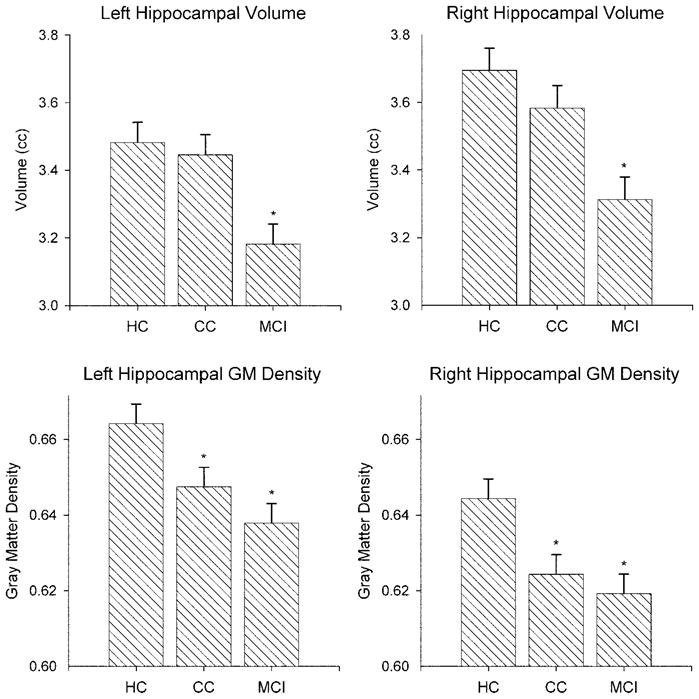
Hippocampal volume and gray matter density by group. Age- and intracranial volume–adjusted means (± SE) for manually segmented left and right hippocampi are shown in the top row. Age-adjusted gray matter densities for the hippocampi are shown in the bottom row.