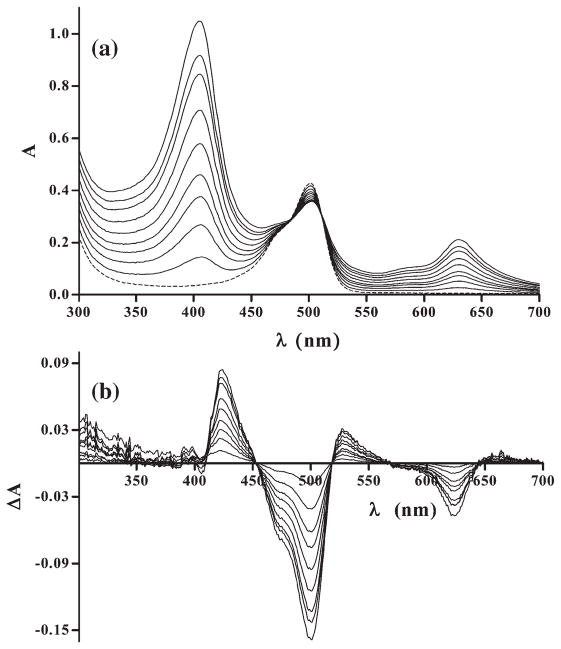
Fig. 3.
Absorption spectra of mixtures of AO and DNA (broken line) and of AO, DNA, and CHL (solid lines) (a). AO and DNA were at 2.8×10⁻⁶ M and 5×10⁻⁵ Mbp concentration, respectively, while CHL concentration varied from 1.0×10⁻⁶ to 1.0×10⁻⁵ M, each step by 1.0×10⁻⁶ M, from bottom to top; l=3 cm. Respective differential spectra are shown in (b).

