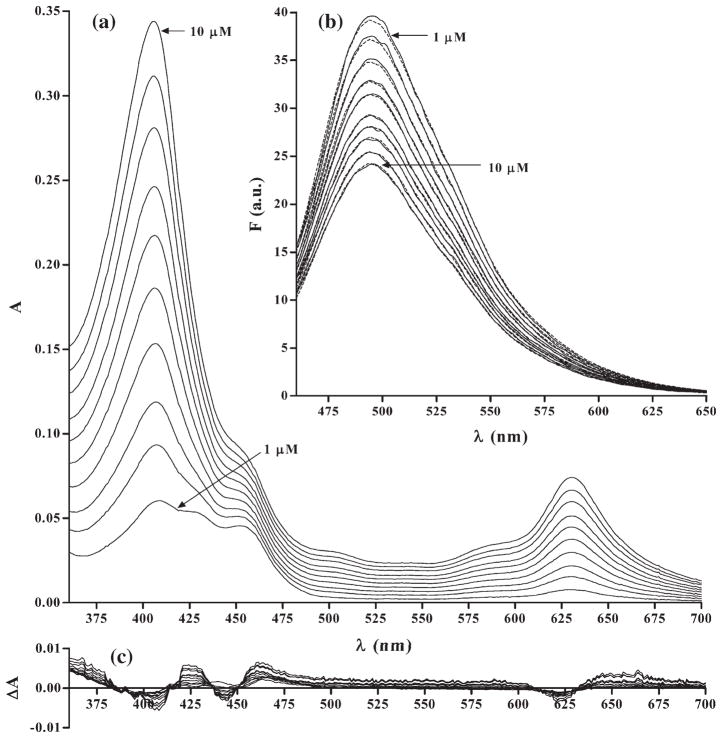
Fig. 5.
Absorption spectra of three-component QM–DNA–CHL mixtures (l=1 cm) (a). Experimentally obtained fluorescence spectra of the same mixtures (solid lines) and respective fluorescence spectra estimated from the concentrations calculated based on the absorption spectra (broken lines) (b). Residuals remaining after iterative fit using least squares approach (c). QM and DNA were at 8×10⁻⁶ M and 4.5×10⁻⁵ Mbp concentration, respectively, while CHL concentration varied from 1.0×10⁻⁶ to 1.0×10⁻⁵ M, each step by 1.0×10⁻⁶ M, selected concentrations are indicated by arrows.

