Fig. 6.

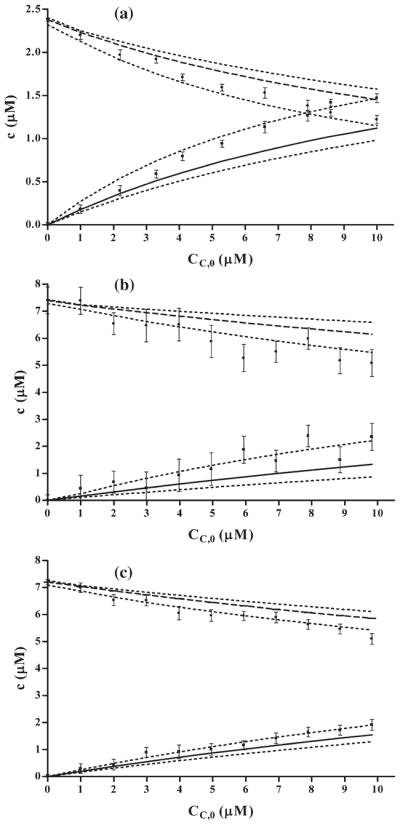
Comparison of concentrations of intercalator–DNA and intercalator–CHL complexes calculated based on data from two-component systems (solid lines – intercalator–CHL, dashed lines – intercalator–DNA complexes, dotted lines illustrate confidence limits in concentration estimates resulting from uncertainty of Ka, Ki and n parameter estimates), and from iterative least squares fit to absorption spectra (dots – intercalator–DNA, squares –intercalator–CHL complexes, respectively). (a) AO–DNA–CHL mixtures, concentrations of AO and DNA were 2.8×10⁻⁶ M and 3.25×10⁻⁵ Mbp, respectively, (b) DOX–DNA–CHL mixtures, concentrations of DOX and DNA were 8×10⁻⁶ M and 3×10⁻⁵ Mbp, respectively, (c) QM–DNA–CHL mixtures, concentrations of QM and DNA were 8 × 10⁻⁶ M and 4.5×10⁻⁵ Mbp, respectively.
