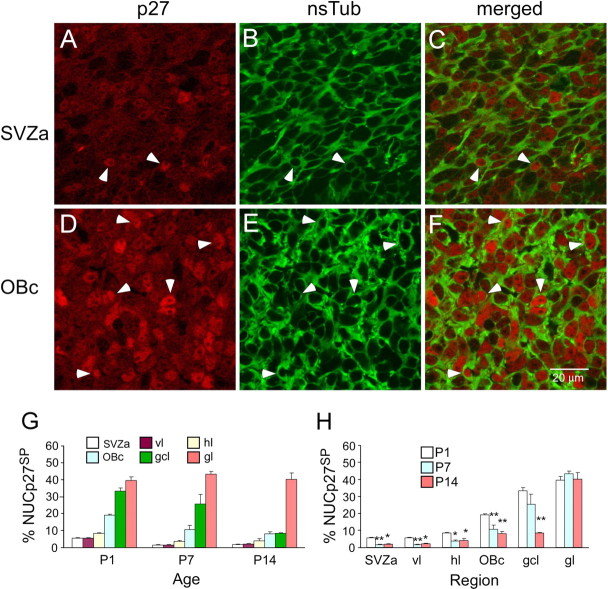
Figure 2.
The percentage of cells displaying strong nuclear p27 expression increases from the SVZa to the OBc and is highest in the granule cell and glomerular layers of the olfactory bulb. A–F, Representative photomicrographs of the SVZa (A–C) and OBc (D–F) stained for anti-p27 and anti-nsTub. A low number of RMS cells in the SVZa are NUCp27SP, whereas more RMS cells in the OBc are NUCp27SP. Arrowheads point to examples of identical NUCp27SP cells. p27SP nuclei (A, D) are surrounded by nsTub(+) cytoplasm (B, E), indicating that these are NUCp27SP/nsTub double-labeled cells (C, F). G, Histogram of the percentage of NUCp27SP cells shows an increasing gradient of expression from the SVZa to the neuronal cell layers of the olfactory bulb. H, Histogram showing NUCp27SP cells is significantly decreased at P7 and P14 in each subdivision of the RMS compared with the percentage at P1. There is no significant difference between P7 and P14 in any of the subdivisions of the RMS. For the gcl, this percentage is significantly decreased at P14 compared with P1. No significant difference is observed in the gl between the three ages. Error bars represent SEM. *p < 0.05; **p < 0.01.

