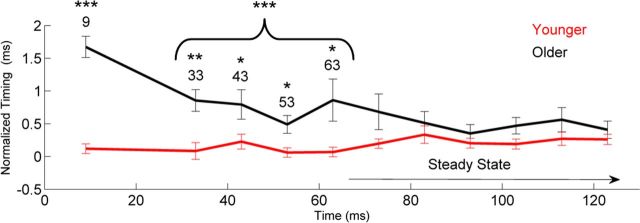
Figure 3.
Neural delays in the aging population. Older adults show a shift in neural response timing for both the onset and transition but not for the steady state. To facilitate visualization of the data, the peak latencies are normalized. Normalization was accomplished by subtracting the expected response timing, based on stimulus characteristics and neural lag, from the actual response latency. Expected latencies were 9 ms for the onset and 33, 43, 53, 63, etc., until 163 ms for peaks during the transition and steady state. This resulted in a normalized value (milliseconds), with 0 indicating that peak occurred at its expected latency. *p < 0.05, **p < 0.01, ***p < 0.001. Error bars represent ±1 SE.

