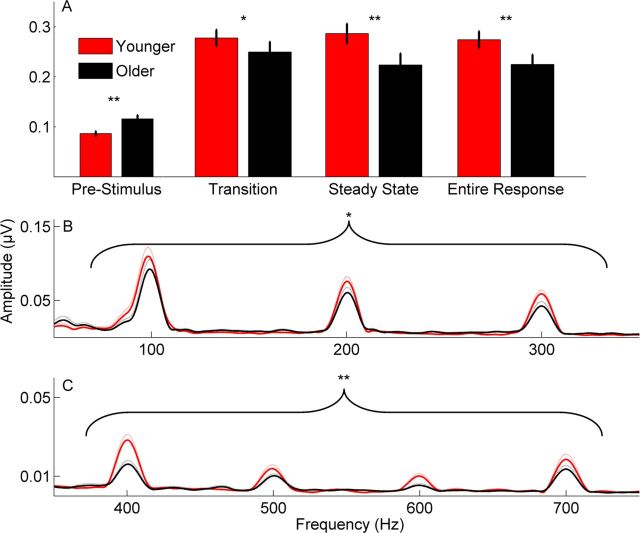
Figure 5.
A, Bar graphs demonstrating significant between-group differences in RMS amplitude across stimulus time ranges. The older adults have higher prestimulus activity as measured by RMS amplitude, yet the younger adults have higher RMS response amplitudes. B, C, Fast Fourier transforms calculated over the entire response. B, Group average responses to added polarities in younger (red) versus older (black) adults. Greater magnitudes were noted in the 20 Hz bins surrounding lower frequencies, which contribute to pitch perception [fundamental frequency (F0), second harmonic (H2), and third harmonic (H3)]. C, Group average responses to subtracted polarities in younger (red) versus older (black) adults. Greater magnitudes for younger adults were noted over the entire response but specifically for H4–H7 (the range encompassing the first formant). *p < 0.05, **p < 0.01. Dotted lines and error bars represent ±1 SE.

