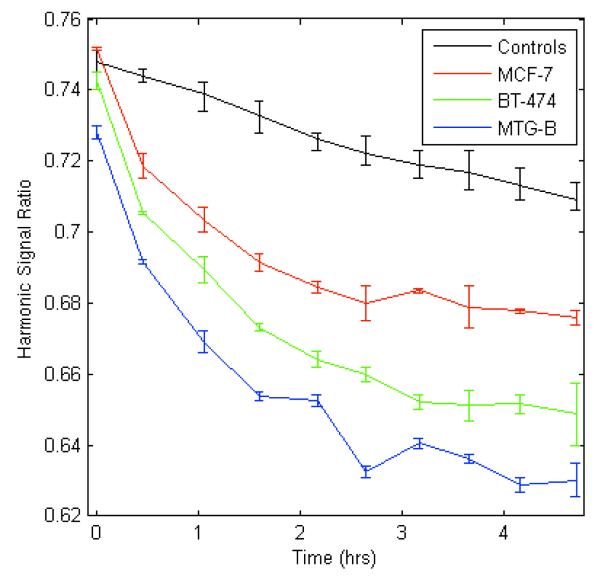
Figure 6. The change in mNP harmonic ratio over time when incubated with three different cell lines. Measurements were acquired at 290 Hz and 10 mT/μo.
Control error bars indicate the range of responses for mNPs in the three different cell culture media. The greatest signal change was demonstrated in the MTG-B cells due to more mNP-cell association.

