
Figure 2.
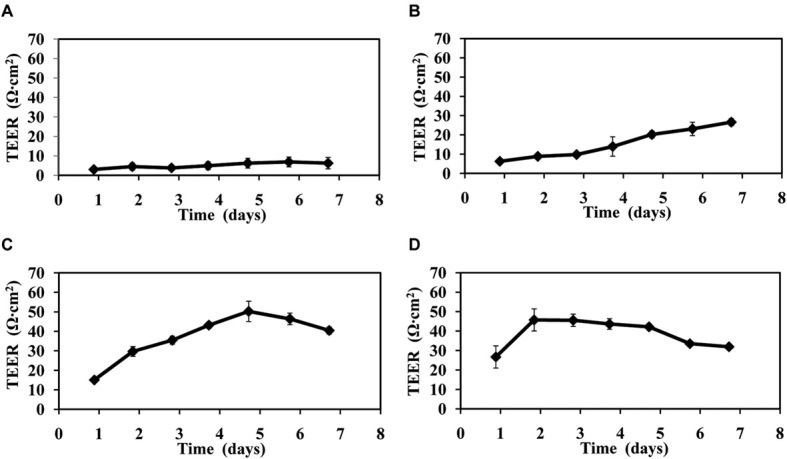
TEER versus time of endothelial cell growth on the membrane in the absence of astrocytes. Profiles from four different endothelial cell-seeding densities: (A) 1 × 10⁵ cells /cm2, (B) 2 × 10⁵ cells/cm2, (C) 4 × 10⁵ cells/cm2, (D) 8 × 10⁵ cells /cm2. Error bars show the standard deviation collected over three independent experiments. Culture media was replaced after TEER measurements were taken each day.