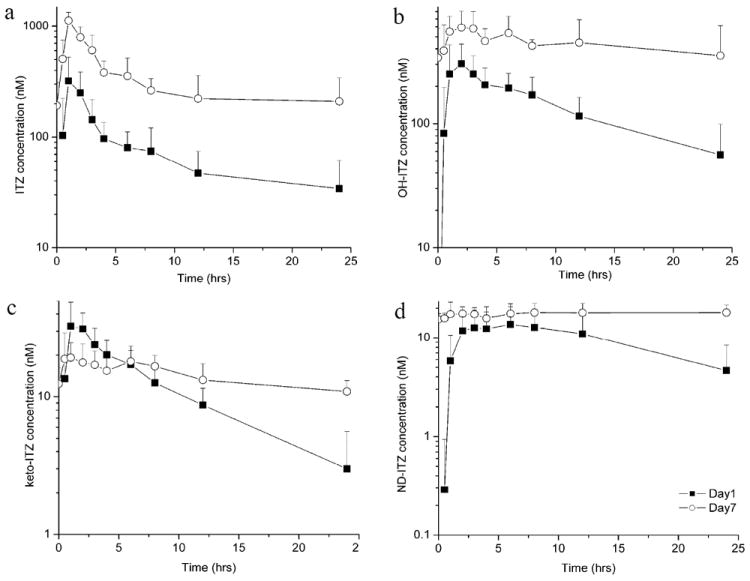
Figure 3.

Mean plasma concentration (± SD) versus time curves for itraconazole (a), hydroxy-itraconazole (OH-ITZ) (b), keto-itraconazole (keto-ITZ) (c) and N-desalkyl-itraconazole (ND-ITZ) (d) on day 1 (solid boxes) and day 7 (open circles) of the study in the six volunteers. The symbols are the mean values of the six subjects and the bars show standard deviation. For keto-ITZ only two subjects had quantifiable plasma concentrations at 24 hours after the first dose and for ND-ITZ only one subject had quantifiable plasma concentrations at 0.5 hours after first ITZ dose. For calculation of the mean concentration other plasma concentrations were considered to be zero.
