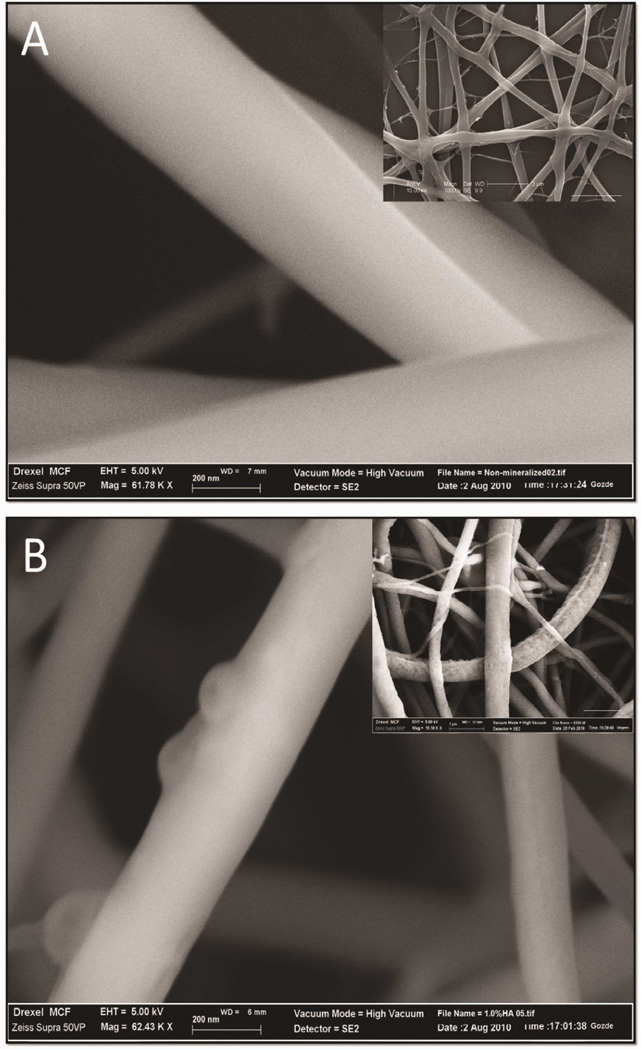
Figure 2. The morphology of electrospun scaffolds evaluated by scanning electron and atomic force microscopy.
Scanning electron micrographs of 0.1% genipin crosslinked CTS-GP (A) and 0.1% genipin crosslinked 1.0% HA-containing (B) 7% chitosan nanofibers. Scale bars are 200nm. Inserts: Typical morphologies of nanofibers at lower magnification (scale bar for insert in A is 2µm and in B is 1µm).

