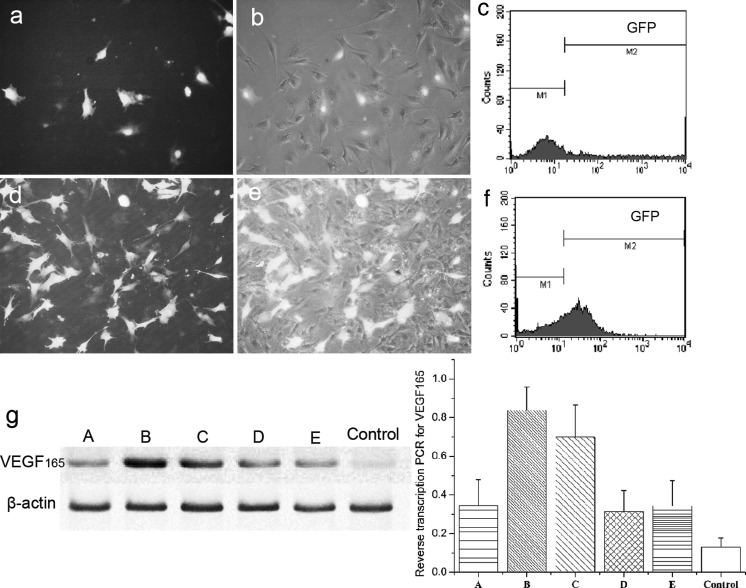
Fig. 2.
GFP and VEGF gene expression of electroporated BMMSCs. Green fluorescence represents the successful electroporation of plasmid into BMMSCs. Electroporated cells after 48 h (a and b). G418 selection after 20 days (d and e) (bright vision) b and e, ×200) dark vision (a and d, ×200). Transfection efficiency as determined by flow cytometry of BMMSCs electroporated after 48 h (c), and selected after 20 days (f). Reverse transcription PCR analysis for VEGF165 levels (the RT-PCR conditions A–E are described in the Materials and Methods section) (g). Values represent mean ± SD. Significance was set at p < 0.05

