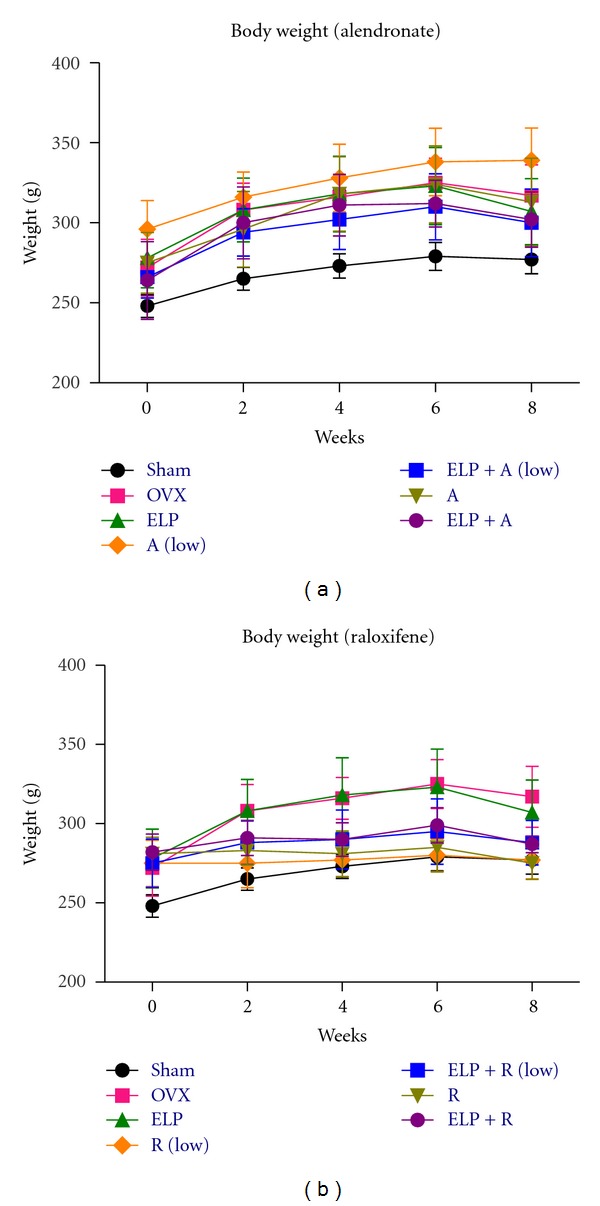
Figure 2.

Mean of rat body weight between week 0 (baseline) and week 8. Rat body weight with different treatment was illustrated: (a) with alendronate; and (b) with raloxifene. The error bar represents the SEM for each treatment group (n = 8 per group).
