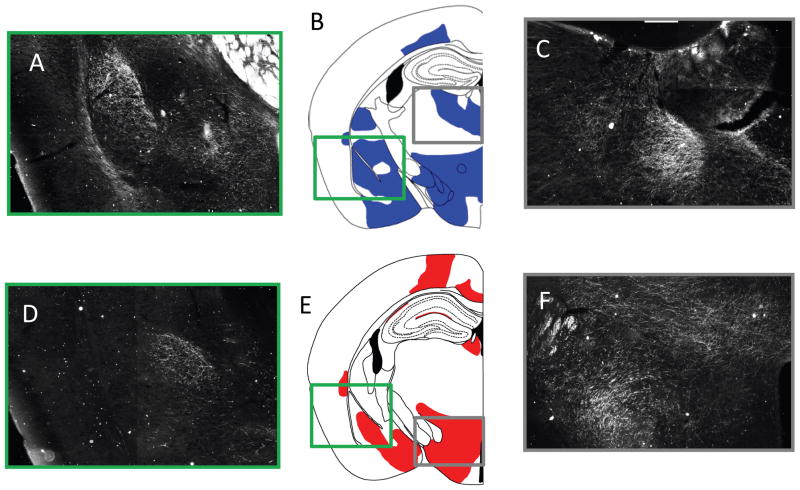
Figure 5. Comparison of the BDA projections of IL/PL.
A) Shows the BDA/ABC/DAB dark-field image composite of 20x images around the amygdala. B) Shows a representative image of the areas showing BDA/ABC/DAB projections from the PL, the green box surrounds the amygdala represented in Part A, while the grey box shows the tracts projecting to the mediodorsal thalamic nucleus highlighted in Part C. C) Shows the BDA/ABC/DAB dark field image composite of 20x images of the mediodorsal thalamic nucleus. D-F Shows the same approximately representative slices of the BDA/ABC/DAB staining from the IL injection site, with the exception that the grey box highlights the posterior hypothalamic regions and the dorsomedial hypothalamic nucleus. Comparable information from the DTI tractography conducted in mice can be found in Figure 3, particularly in rows 3 and 4.

