Figure 1.


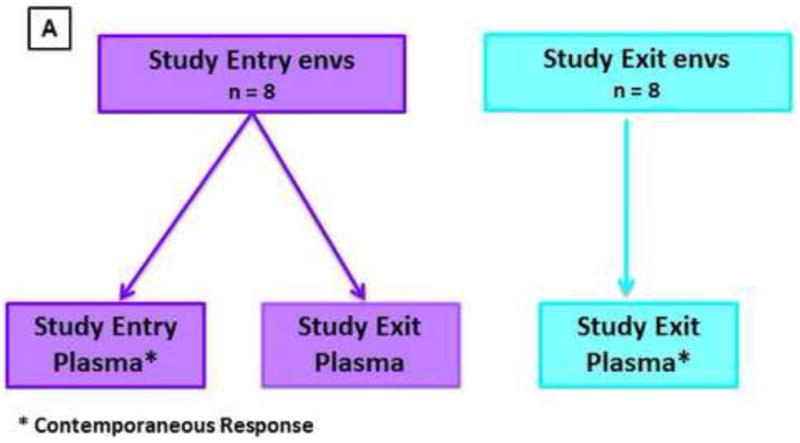
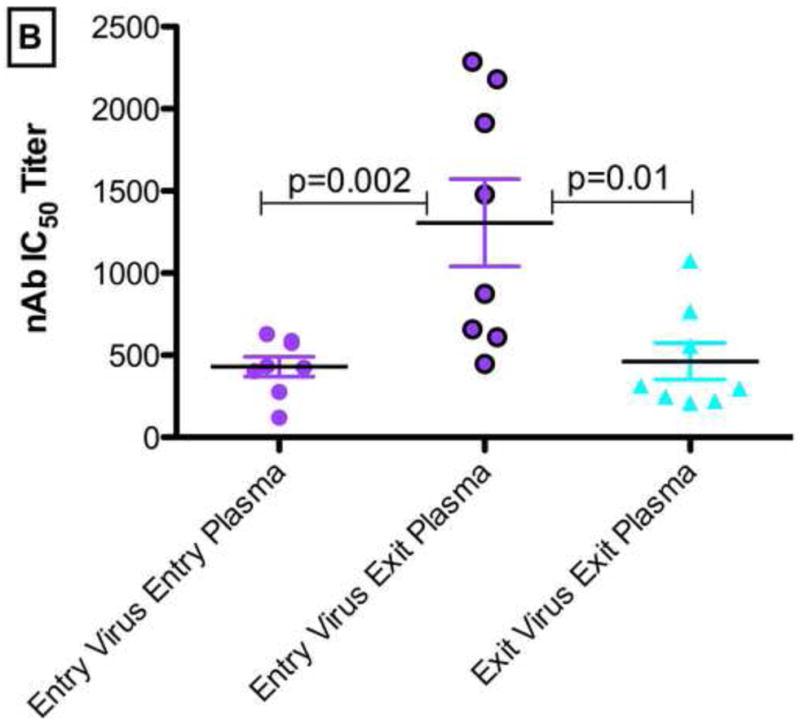
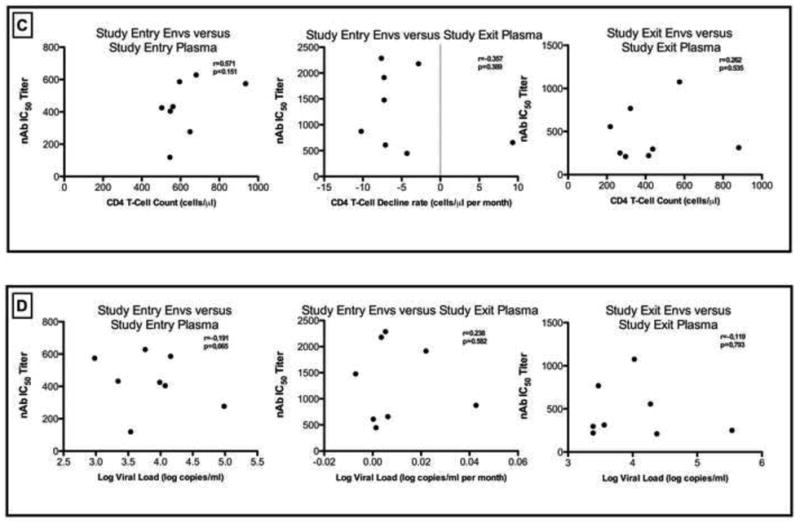
(A). Schematic illustrating the autologous neutralizing antibody challenge assays in all participants over a median of 21 months from study entry to study exit. The average nAb IC50 titers for study entry and exit Envs used in the assays are shown. The study entry Envs were tested against nAbs from the study entry (contemporaneous) and study exit plasma samples. Likewise the study exit Envs were tested against nAbs from the study entry and study exit (contemporaneous) plasma samples. Figure 1(B) depicts the autologous nAb IC50 titers in study participant entry and exit plasma samples for all participants. Figure 1(C) and 1(D) shows the CD4 T-cell decline rate and the log viral load changes over time respectively. P-values <0.05 were considered significant. P value was calculated using the two-tailed Mann-Whitney non-parametric test overall. All the p values (p<0.0125) remained statistically significant after Bonferroni adjustment for multiple comparisons.
