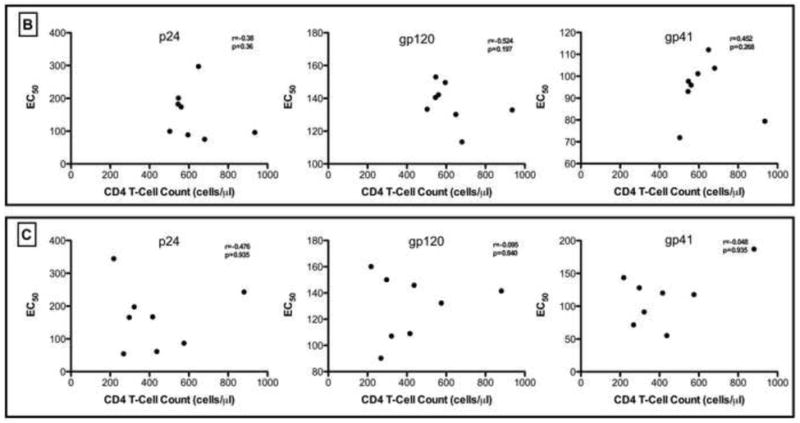
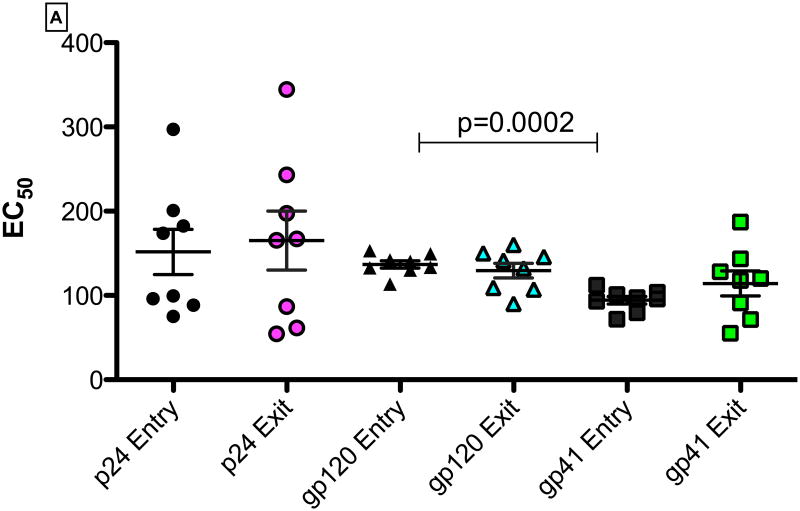
Figure 4.

(A). IgG EC50 binding titers for gp41, gp120 and p24-specific antibodies at study entry and exit time points. Panels for Figure 4(B) and (C) show the correlation of EC50 binding titers for gp41, gp120 and p24-specific antibodies with CD4-T cell counts at study entry and study exit respectively. None of the correlations were statistically significant (p< 0.05).

