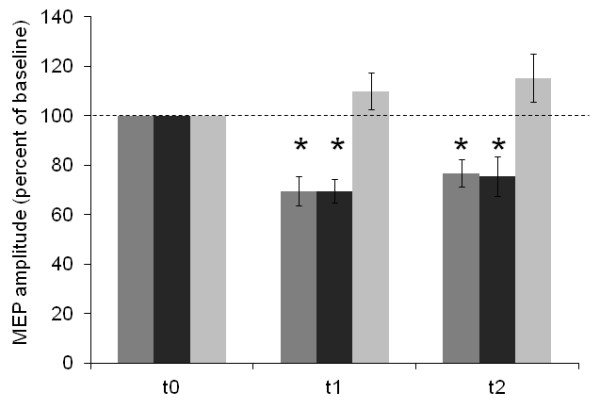
Figure 2.
Changes in baseline-normalized MEP amplitudes of the APB induced by cTBS (%) in 14 MS patients (dark grey columns) and 14 matched control subjects (real cTBS: medium grey columns; sham cTBS: light grey columns). Error bars indicate the standard error of the mean (SEM). Asterisks indicate significant difference from baseline.

