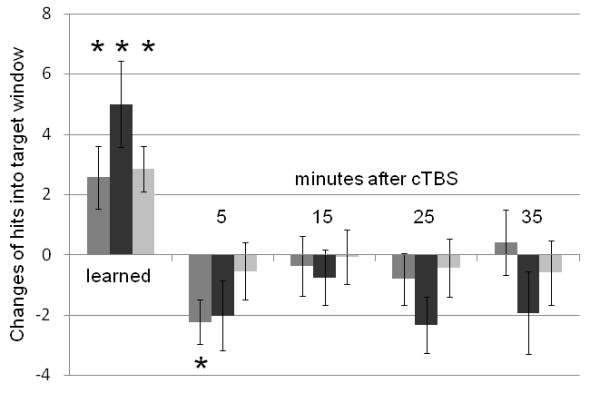
Figure 3.
Changes of force production performance over the course of the eight training blocks (“learned”) and at four time points following cTBS in 14 MS patients (dark grey columns) and 14 matched control subjects (real cTBS: medium grey columns; sham cTBS: light grey columns). Error bars indicate the standard error of the mean (SEM). Asterisks indicate significant difference from baseline after proper training (see methods; “learned”) and from the extrapolated performance trendline at different time intervals (in minutes; “after cTBS”), respectively (two-tailed, one-sample t-test, after FDR correction).

