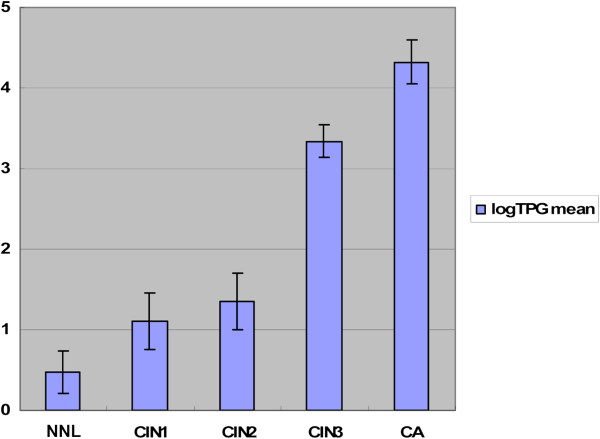
Figure 4.
Quantification of telomerase activity in different biopsy groups. The vertical axis represents the log10 [TPG] levels for telomerase activity in the samples. Telomerase activity showed no difference neither in CIN1 to NNL groups (P=0.153), nor in CIN2 to CIN1 groups (p=0.619). CIN3 exhibited high levels of telomerase activity compared with CIN2 group (P=0.000). Samples with CA expressed higher levels of telomerase activity than with CIN3 (P=0.006).

