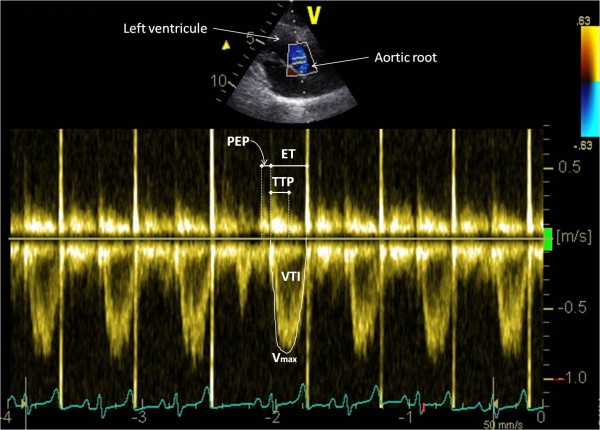
Figure 2.
Aortic flow velocity spectrum obtained from a left parasternal long axis five chamber view. The peak velocity of the aortic flow (Vmax), the velocity time integral (VTI), the ejection time (ET), the time to peak velocity (TTP) and the pre-ejection period (PEP) of the aortic flow were measured as shown.

