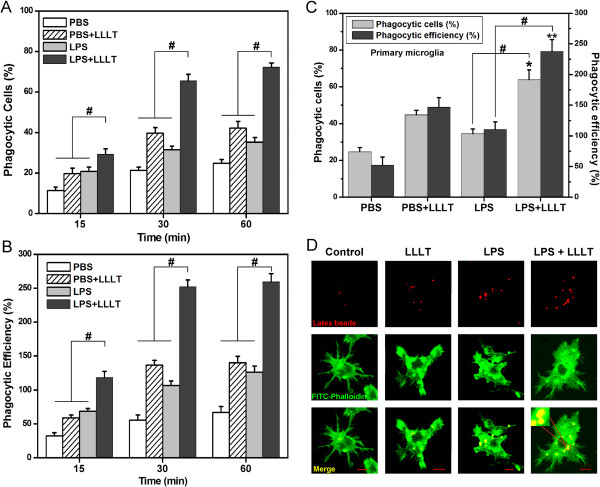
Figure 4.
Effects of LLLT on phagocytic function of activated microglial cells. (A and B) BV-2 cells with or without LLLT (20 J/cm2) treatment incubated with microspheres for indicated time. (A) Quantification of LLLT-mediated microglial phagocytosis; (B) The number of microspheres taken up per BV-2 cell (n = 4; #P <0.05 versus indicated cells). (C) LLLT-mediated phagocytic response in primary microglia at 30 min. (n = 4; *P <0.05 and **P <0.05 versus corresponding control cells, #P <0.05 versus indicated cells). (D) Fluorescent images of the distinct microglial phagocytosis. Microglial BV-2 cells with or without LPS or LPS plus LLLT treatment. Immediately thereafter, fluorescent microspheres (red) were added for 30 min. Cells were then fixed with 4% paraformaldehyde and stained with FITC-labeled phalloidin to visualize F-actin (green) and confocal Z-stacks were acquired. Images shown are representative of approximately 100 cells. Bar = 10 μm. LLLT, low-level laser therapy; LPS, lipopolysaccharide.

