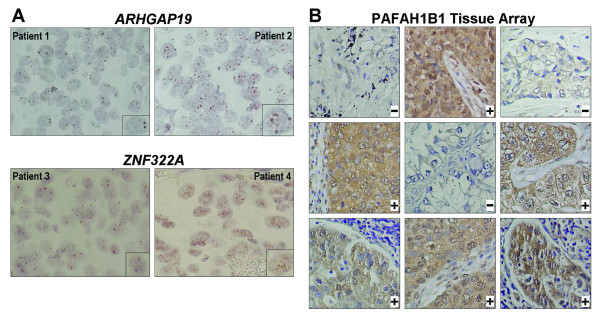
Figure 4.
DNA copy number and protein expression level validation in specimens from lung cancer patients. (A) Representative CISH images of ARHGAP19 and ZNF322A genes in paraffin-embedded lung tumor tissue. Images taken from tumor without gene copy number amplification (left) and with gene copy number amplification (right). The enlarged image of one nucleus is shown on the lower right corner. CISH images: 400X magnification. (B) Representative IHC images of PAFAH1B1 protein in tissue array. Patients with protein overexpression are indicated by + symbol. Patients with normal expression are indicated by – symbol. IHC images: 200X magnification.

