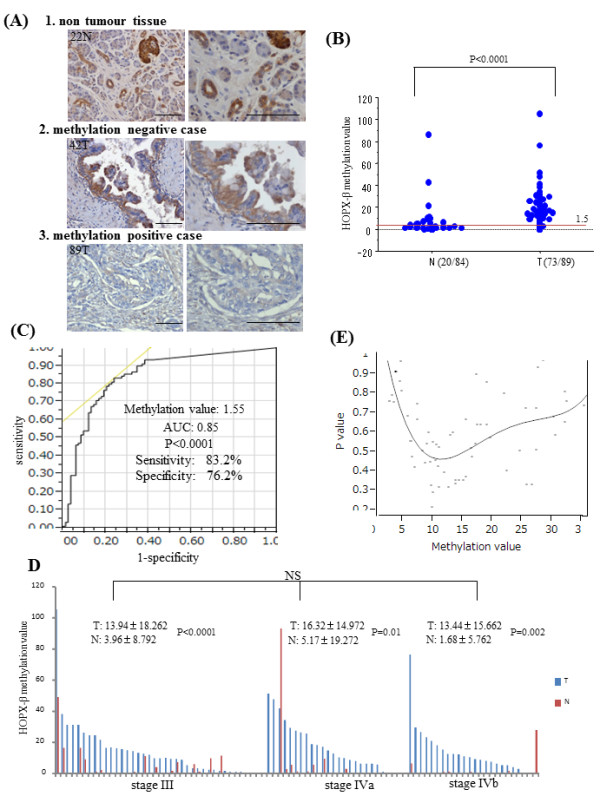
Figure 4.

Immunohistochemistry and Quantitative methylation analysis in 89 samples. (A) Representative immunohistochemical staining for HOPX in normal tissues and primary tumor with or without HOPX-β hypermethylation (original magnification, left X200, right X400). scale Bars, 100 μm. (B) Frequency of HOPX-β hypermethylation by Q-MSP. Dashed line indicates the optimal cut-off value (1.5). (C) ROC curve of HOPX-β methylation for detection of PC. Area under the curve (AUC) represents the accuracy in discriminating normal from tumor in term of sensitivity and specificity (P < 0.0001). (D) Methylation value of HOPX-β in JPS stage III, IVa and IVb. Data are expressed as mean ± SD. (E) Identification of an optimal cut-off value for the prognosis using the log rank prognostic analysis.
