
Figure 5.
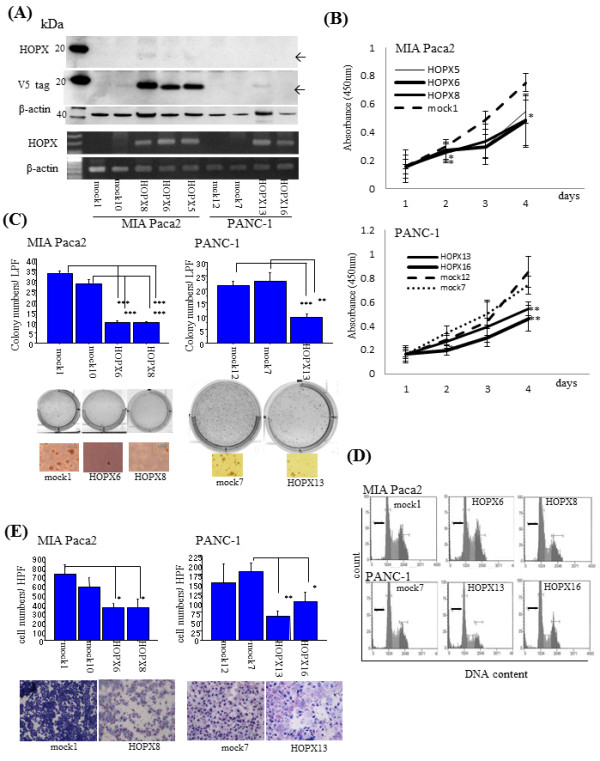
Functional analysis of HOPX in PC cells. (A) HOPX expression level in HOPX expressing stable cell lines was determined by mRNA expression (lower panel) and protein expression (upper panel). HOPX protein was detected by WB with HOPX antibody (3D6) and the flag V5 antibody. β-actin was shown as a loading control. (B) Proliferation assay was performed for 5 days. Data are shown as absorbance at 450 nm. error bars, SD. (C) Anchorage-independent colony formation assay was performed. After 3 weeks of cell culture, colonies were counted and photographed at 40× magnification under a microscope. Colonies were also visualized by ethidium bromide staining. error bars, SD. (D) Image of cell cycle assay. Thick black bars, subG1 phase. (E) Matrigel invasion assay. After fixation and staining, invading cells were photographed and counted at 100x magnification. error bars, SD.