Figure 1.
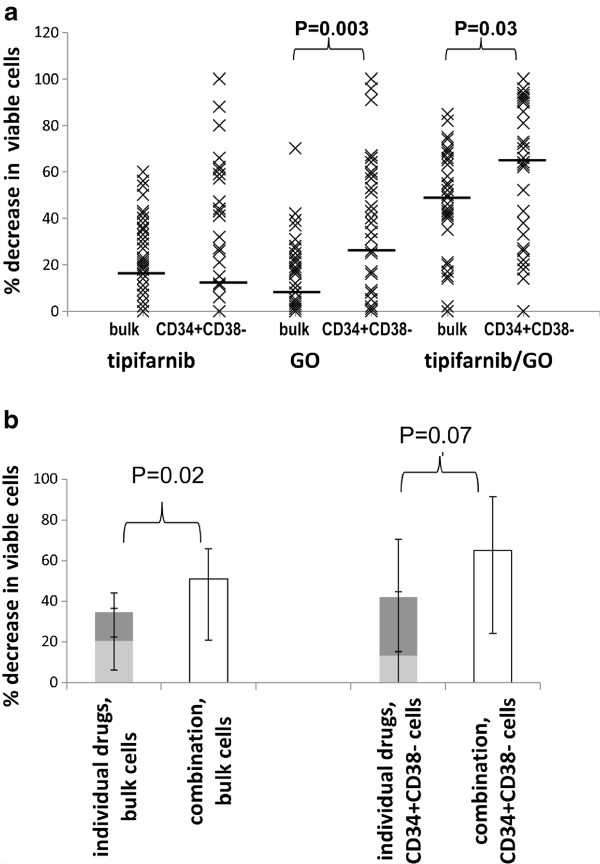
Chemosensitivity to Tipifarnib/GO. Percentage decrease in viable bulk and CD34+CD38- patient cells compared to untreated controls after 48 hour drug treatment with 10 ng/ml GO, 5 μM tipifarnib or the combination. N = 34 A. Individual values - median values are indicated by black bars. B. Median values showing that overall, the drug combination is significantly more toxic (bulk cells) or as toxic (LSPC) as the sum of the individual drugs. Key: tipifarnib = light grey bars, GO = dark grey bars, combination = white bars, errors bars = interquartile range

