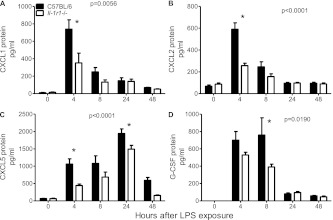
Figure 3.
Cytokine concentration in the BAL of Il-1r1−/− mice after exposure to LPS, compared with C57BL/6 control mice. (A) CXCL1 at 4 hours (*P < 0.0001). (B) CXCL2 at 4 hours (*P < 0.0001). (C) CXCL5 at 4 hours (*P < 0.01) and 48 hours (*P < 0.05). (D) Granulocyte colony–stimulating factor (G-CSF) expression at 8 hours (*P < 0.01; n = 10–12 mice per time point).

