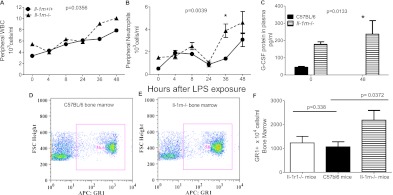
Figure 5.
Differences in peripheral and bone marrow cell counts in Il-1rn−/− mice after exposure to LPS. (A) Total peripheral WBC and (B) peripheral neutrophil counts in Il-1rn−/− mice, compared with littermate control mice (Il-1rn+/+). Peripheral neutrophil counts at 36 hours (*P < 0.05) in Il-1rn−/− mice (n = 9–17 mice per time point). (C) G-CSF protein expression in Il-1rn−/− mice 48 hours (*P < 0.05) after exposure to LPS, compared with C57BL/6 mice (n = 5–7 mice at each time point). (D) Representative dot plots illustrate the relative percentage of GR1+ cells in the unstimulated marrow of C57BL/6 mice, compared with (E) marrow in Il-1rn−/− mice. APC, allophycocyanin; FSC, forward scatter. (F) Absolute number of GR1+ cells in Il-1rn−/− mice versus C57BL/6 mice, as well as GR1+ cells in the bone marrow of Il-1r1−/− versus C57BL/6 mice (n = 3–4 mice per genotype).

